SRE事件响应代理:构建自主基础设施运维智能体
技术背景
传统SRE依赖人工值班,响应慢且易出错。本教程旨在构建自主代理,通过MCP工具安全地读写基础设施,实现事件响应自动化。适用场景包括故障排查、配置修复、部署验证等。主要限制是工具权限需严格限定,且代理决策依赖工具描述质量。
核心原理
代理基于Claude Agent SDK的推理循环,通过MCP服务器暴露的工具与外部系统交互。工具描述驱动代理决策,而非复杂提示。代理综合多源信号(指标、日志、配置)形成诊断,并通过安全钩子确保写操作合规。
架构分析
系统采用MCP模式,代理与独立子进程的MCP服务器通过stdio/JSON-RPC通信。服务器注册12个工具,分为基础设施、Prometheus、诊断和文档四类。安全设计包括目录限制、命令白名单和PreToolUse钩子。代理配置通过ClaudeAgentOptions指定系统提示、工具列表和钩子。
完整实战教程
引言
凌晨3点,你的寻呼机响了,API开始返回500错误。你半睡半醒,盯着仪表盘,在十几个服务之间关联指标和日志,而客户影响每分钟都在扩大。本笔记本构建了一个SRE事件响应代理,它可以自主处理该工作流:调查事件、识别根本原因、应用修复措施并记录结果。
在笔记本02中,我们构建了一个可以*读取*外部系统的可观测性代理。本笔记本更进一步。该代理还可以采取行动,编辑配置文件和重启服务以修复其发现的问题。它使用Claude Agent SDK和MCP工具,这些工具被限定为安全的基础设施访问。
你将学到什么
- 如何通过使用受限目录、命令白名单和验证钩子来限定MCP工具,从而为代理提供安全的基础设施写入访问
- 为什么清晰的工具描述比精心设计的提示更能有效地驱动自主代理行为
- 代理如何综合跨生产信号(如指标、日志、警报和配置)来构建一个连贯的诊断,而任何单一数据源都无法单独揭示这些信息
- 如何构建人机协作工作流,将调查与修复分开,以便你控制代理何时自主行动
最后,我们提供将代理连接到您自己的基础设施并使用您团队已有的平台进行扩展的指导。
先决条件
要运行本笔记本,您需要:
- Docker 在本地运行以模拟基础设施(安装指南)
- Anthropic API密钥 通过Claude Agent SDK运行代理(获取API密钥)
- Python 3.11+ 并安装
claude-agent-sdk和httpx包 infra_setup.py和sre_mcp_server.py与本笔记本位于同一目录(包含在仓库中)
您不需要任何额外的外部账户即可运行本笔记本的核心步骤。基础设施(PostgreSQL、Prometheus、API服务器)完全在本地Docker容器中运行。后续部分提供使用外部生产服务扩展代理的指导。
从cookbooks仓库运行? 在运行笔记本之前,请确保您的工作目录是claude_agent_sdk/site_reliability_agent/。
步骤 0:环境设置
在此目录中创建一个 .env 文件,并填入你的 Anthropic API 密钥:
ANTHROPIC_API_KEY=your-key-here
%%capture
%pip install claude-agent-sdk httpx python-dotenv
import os
import sys
import shlex
import subprocess
import time
from typing import Any
from pathlib import Path

import httpx
from dotenv import load_dotenv

from claude_agent_sdk import (
    ClaudeAgentOptions,
    query,
    AssistantMessage,
    TextBlock,
    ToolUseBlock,
    ResultMessage,
)

load_dotenv()

if not os.environ.get("ANTHROPIC_API_KEY"):
    raise ValueError("ANTHROPIC_API_KEY not set. Add it to a .env file.")

MODEL = "claude-opus-4-6"
步骤 1:生成基础设施文件
我们在此笔记本旁边附带了两个配套文件:
infra_setup.py— 生成基于 Docker 的基础设施(Compose 配置、Prometheus、API 服务器、流量生成器)。请查看此文件以了解如何为代理测试设置本地环境。sre_mcp_server.py— 代理与之通信的 MCP 工具服务器。这是最重要的文件,请务必阅读——它展示了如何定义工具、实现安全作用域的处理程序,以及如何使用 JSON-RPC 将所有内容连接起来。如果你正在构建自己的代理集成,请参考此模式,了解如何为代理提供合适的工具来完成任务。
步骤 1a:基础设施设置
infra_setup.py 生成一个完整的本地环境,用于模拟生产事故:
config/docker-compose.yml— 定义四个服务:PostgreSQL(数据库)、API 服务器(查询数据库的 FastAPI 应用)、流量生成器(持续发送 HTTP 请求以模拟负载)以及 Prometheus(从 API 服务器抓取指标)。这就是我们将要破坏和修复的系统。config/prometheus.yml— 配置 Prometheus 每 5 秒抓取一次 API 服务器的/metrics端点,使我们能够实时查看错误率、延迟和数据库连接使用情况。config/api-server.env— API 服务器的环境变量,包括DB_POOL_SIZE(我们将错误配置以触发事故的参数)。services/api_server.py— 一个 FastAPI 应用,提供 HTTP 请求服务、连接 PostgreSQL 并暴露 Prometheus 指标。它记录了请求计数、延迟直方图和数据库连接池仪表。scripts/traffic_generator.py— 向 API 服务器发送稳定的请求流,以便指标始终流动。这使得事故在 Prometheus 中立即可见。hooks/— 安全钩子脚本(在步骤 5 中稍后填充)。
如果你要将其适配到自己的基础设施,可以将这些生成的文件替换为与真实服务的连接,但模式(Docker Compose + Prometheus + 仪表化服务)是相同的。
assert os.path.exists("infra_setup.py"), (
    "infra_setup.py not found — ensure both setup scripts are in the same directory as this notebook."
)

subprocess.run([sys.executable, "infra_setup.py"], check=True)
步骤 1b:MCP 服务器
sre_mcp_server.py 是工具服务器,Claude Agent SDK 在代理执行期间将其作为子进程启动。它作为独立的 Python 文件包含在内,以便你可以直接阅读和修改。
花点时间查看 sre_mcp_server.py,因为理解其结构是构建你自己的代理集成的关键。该服务器实现了基于 stdin/stdout 的 JSON-RPC 协议:当 Agent SDK 需要调用工具时,它会向服务器的 stdin 写入请求,服务器分派给相应的处理程序,并将结果写回 stdout。
该服务器注册了12 个工具,涵盖四个类别:
| 类别 | 工具 | 用途 |
|----------|-------|---------|
| Prometheus | query_metrics, list_metrics, get_service_health | 查询指标、发现可用数据、获取健康摘要 |
| 基础设施 | read_config_file, edit_config_file, run_shell_command, get_container_logs | 读取/写入配置、运行 Docker 命令、检查日志 |
| 诊断 | get_logs, get_alerts, get_recent_deployments, execute_runbook | 应用程序日志、警报历史、部署跟踪、结构化操作手册 |
| 文档 | write_postmortem | 将事件事后分析写入磁盘 |
每个工具都有一个带有丰富描述的 JSON Schema 定义,代理通过读取这些描述来决定何时以及如何使用每个工具。编写良好的工具描述是影响代理效能的最重要因素之一。
该服务器还包括生产扩展工具,用于 PagerDuty(事件管理)和 Confluence(事后分析文档),当设置相应的 API 密钥时这些工具会激活。请参阅本笔记本末尾的“进一步探索”部分。
架构概览
SRE 代理采用模型上下文协议(MCP)模式:代理与作为独立子进程运行的工具服务器通信,通过标准输入/输出(stdin/stdout)连接。
Claude Agent SDK  <-- query() loop streams responses
│
▼
MCP Server (subprocess via stdio/JSON-RPC)
│
├── Prometheus (metrics & health checks)
├── Docker (container logs & commands)
└── Config Management (read/edit env files)
为什么使用子进程? 将工具服务器作为独立进程运行提供了隔离性,这样即使某个工具处理程序崩溃或挂起,代理也不会被拖垮。同时,这也使得代理的推理循环与基础设施访问层之间能够实现清晰的分离。
步骤 2:基础设施工具 — Docker 与配置管理
任何 SRE 代理的基础都是检查和修改基础设施的能力。我们定义了两类工具:
- 读取工具:
read_config_file、get_container_logs— 可随时安全调用 - 写入工具:
edit_config_file、run_shell_command— 修改状态,需要安全检查
每个工具都按照 MCP 协议定义为 JSON Schema 对象。代理读取这些描述来决定何时以及如何使用每个工具。
infrastructure_tools = [
    {
        "name": "read_config_file",
        "description": (
            "Read a configuration file from the project. "
            "Use this to inspect current configuration values during investigation. "
            "Common files: "
            "config/api-server.env (DB_POOL_SIZE, timeouts, etc.), "
            "config/docker-compose.yml (service definitions and resource limits)."
        ),
        "inputSchema": {
            "type": "object",
            "properties": {
                "path": {
                    "type": "string",
                    "description": "Relative path to config file (must be in config/ directory)",
                },
            },
            "required": ["path"],
        },
    },
    {
        "name": "edit_config_file",
        "description": (
            "Edit a configuration file to fix misconfigurations. "
            "ONLY use this for remediation after confirming the root cause. "
            "Restricted to files in the config/ directory."
        ),
        "inputSchema": {
            "type": "object",
            "properties": {
                "path": {
                    "type": "string",
                    "description": "Relative path to config file (must be in config/ directory)",
                },
                "old_value": {
                    "type": "string",
                    "description": "The exact text to find and replace",
                },
                "new_value": {
                    "type": "string",
                    "description": "The new text to replace it with",
                },
            },
            "required": ["path", "old_value", "new_value"],
        },
    },
    {
        "name": "run_shell_command",
        "description": (
            "Run a shell command for infrastructure management. "
            "Restricted to docker-compose and docker commands only. "
            "Use for: restarting services, checking container status, rebuilding images."
        ),
        "inputSchema": {
            "type": "object",
            "properties": {
                "command": {
                    "type": "string",
                    "description": "Shell command (must start with 'docker-compose' or 'docker')",
                },
            },
            "required": ["command"],
        },
    },
    {
        "name": "get_container_logs",
        "description": (
            "Get recent logs from a Docker container. "
            "Use this to look for error messages, stack traces, or unusual patterns. "
            "Valid containers: api-server, postgres, prometheus, traffic-generator."
        ),
        "inputSchema": {
            "type": "object",
            "properties": {
                "container": {"type": "string", "description": "Container name"},
                "lines": {
                    "type": "integer",
                    "description": "Number of log lines (default 50)",
                    "default": 50,
                },
            },
            "required": ["container"],
        },
    },
]
基础设施工具处理器
以下是每个基础设施工具的处理程序实现。请特别注意写入工具上的安全检查——这些是让代理安全地获得真实基础设施访问权限的护栏:
edit_config_file将写入限制在config/目录内run_shell_command仅允许以docker-compose或docker开头的命令get_container_logs根据白名单验证容器名称
SRE_PROJECT_ROOT = os.getcwd()


async def read_config_file(path: str) -> dict[str, Any]:
    """Read a config file, restricted to the config/ directory."""
    full_path = Path(os.path.join(SRE_PROJECT_ROOT, path)).resolve()
    allowed_root = Path(SRE_PROJECT_ROOT, "config").resolve()
    if not full_path.is_relative_to(allowed_root):
        return {
            "content": [
                {"type": "text", "text": "Error: Can only read from config/ directory"}
            ],
            "isError": True,
        }
    with open(full_path, "r") as f:
        content = f.read()
    return {"content": [{"type": "text", "text": content}], "isError": False}


async def edit_config_file(path: str, old_value: str, new_value: str) -> dict[str, Any]:
    """Edit a config file by replacing old_value with new_value. Restricted to config/ directory."""
    full_path = Path(os.path.join(SRE_PROJECT_ROOT, path)).resolve()
    allowed_root = Path(SRE_PROJECT_ROOT, "config").resolve()
    if not full_path.is_relative_to(allowed_root):
        return {
            "content": [
                {
                    "type": "text",
                    "text": "Error: Can only edit files in config/ directory",
                }
            ],
            "isError": True,
        }
    with open(full_path, "r") as f:
        content = f.read()
    if old_value not in content:
        return {
            "content": [
                {"type": "text", "text": f"Error: '{old_value}' not found in {path}"}
            ],
            "isError": True,
        }
    new_content = content.replace(old_value, new_value, 1)
    with open(full_path, "w") as f:
        f.write(new_content)
    return {
        "content": [
            {
                "type": "text",
                "text": f"Updated {path}: replaced '{old_value}' with '{new_value}'",
            }
        ],
        "isError": False,
    }


async def run_shell_command(command: str) -> dict[str, Any]:
    """Run a shell command. Restricted to docker/docker-compose commands."""
    args = shlex.split(command)
    if not args or args[0] not in ("docker-compose", "docker"):
        return {
            "content": [
                {
                    "type": "text",
                    "text": "Error: Only docker and docker-compose commands are allowed",
                }
            ],
            "isError": True,
        }
    result = subprocess.run(
        args, capture_output=True, text=True, cwd=SRE_PROJECT_ROOT, timeout=60
    )
    output = result.stdout + result.stderr
    return {
        "content": [{"type": "text", "text": output or "(no output)"}],
        "isError": result.returncode != 0,
    }


async def get_container_logs(container: str, lines: int = 50) -> dict[str, Any]:
    """Get container logs. Validates container name against whitelist."""
    allowed = {"api-server", "postgres", "prometheus", "traffic-generator"}
    if container not in allowed:
        return {
            "content": [
                {"type": "text", "text": f"Error: Container must be one of {allowed}"}
            ],
            "isError": True,
        }
    result = subprocess.run(
        [
            "docker-compose",
            "-f",
            "config/docker-compose.yml",
            "logs",
            "--tail",
            str(lines),
            container,
        ],
        capture_output=True,
        text=True,
        cwd=SRE_PROJECT_ROOT,
    )
    return {
        "content": [
            {"type": "text", "text": result.stdout or result.stderr or "(no logs)"}
        ],
        "isError": False,
    }
第3步:Prometheus — 指标与健康检查
Prometheus 是我们 SRE 代理的可观测性层。它提供定量信号,指示是否出现问题,例如错误率飙升、延迟攀升或数据库连接耗尽。
我们定义了三个 Prometheus 工具:
query_metrics— 运行任意 PromQL 查询(代理可以根据其正在调查的内容自行构造查询)list_metrics— 发现可用的指标get_service_health— 一个预构建的健康摘要,在一次调用中检查错误率、延迟和数据库连接
PROMETHEUS_URL = "http://localhost:9090"

prometheus_tools = [
    {
        "name": "query_metrics",
        "description": (
            "Query Prometheus metrics using PromQL. "
            "Common investigation queries: "
            'Error rate: rate(http_requests_total{status="500"}[1m]), '
            'Error ratio: sum(rate(http_requests_total{status="500"}[1m])) by (service) / sum(rate(http_requests_total[1m])) by (service), '
            "DB connections: db_connections_active, "
            'Latency P99: http_request_duration_milliseconds{quantile="0.99"}, '
            "CPU usage: process_cpu_seconds_total."
        ),
        "inputSchema": {
            "type": "object",
            "properties": {
                "promql": {"type": "string", "description": "PromQL query expression"},
            },
            "required": ["promql"],
        },
    },
    {
        "name": "list_metrics",
        "description": "List all available Prometheus metric names. Use this to discover what metrics are being collected.",
        "inputSchema": {"type": "object", "properties": {}},
    },
    {
        "name": "get_service_health",
        "description": (
            "Get a comprehensive health summary for all services. "
            "Returns error rates, latency percentiles, and DB connection status in one call. "
            "Use this as a starting point for any investigation."
        ),
        "inputSchema": {"type": "object", "properties": {}},
    },
]
Prometheus 工具处理器
以下处理器查询 Prometheus HTTP API。get_service_health 将多个 PromQL 查询聚合为一份结构化健康报告,让代理在决定深入排查之前快速了解整体状况。
async def query_metrics(promql: str) -> dict[str, Any]:
    """Query Prometheus with a PromQL expression."""
    try:
        async with httpx.AsyncClient() as client:
            response = await client.get(
                f"{PROMETHEUS_URL}/api/v1/query",
                params={"query": promql},
                timeout=10.0,
            )
            response.raise_for_status()
            data = response.json()

        if data["status"] != "success" or not data["data"]["result"]:
            return {
                "content": [
                    {"type": "text", "text": f"No results for query: {promql}"}
                ],
                "isError": False,
            }

        results = []
        for r in data["data"]["result"]:
            metric = r["metric"]
            value = r["value"][1] if "value" in r else "N/A"
            label = ", ".join(f"{k}={v}" for k, v in metric.items() if k != "__name__")
            name = metric.get("__name__", "")
            results.append(f"{name}{{{label}}}: {value}")

        return {
            "content": [{"type": "text", "text": "\n".join(results)}],
            "isError": False,
        }
    except Exception as e:
        return {
            "content": [{"type": "text", "text": f"Prometheus query error: {e}"}],
            "isError": True,
        }


async def list_metrics() -> dict[str, Any]:
    """List all available Prometheus metric names."""
    try:
        async with httpx.AsyncClient() as client:
            response = await client.get(
                f"{PROMETHEUS_URL}/api/v1/label/__name__/values", timeout=10.0
            )
            response.raise_for_status()
            data = response.json()
        metrics = data.get("data", [])
        return {
            "content": [
                {
                    "type": "text",
                    "text": f"Available metrics ({len(metrics)}):\n"
                    + "\n".join(sorted(metrics)),
                }
            ],
            "isError": False,
        }
    except Exception as e:
        return {
            "content": [{"type": "text", "text": f"Error listing metrics: {e}"}],
            "isError": True,
        }


async def get_service_health() -> dict[str, Any]:
    """Get a comprehensive health summary across all services."""
    health_queries = {
        "error_rate_per_service": 'sum(rate(http_requests_total{status="500"}[1m])) by (service)',
        "request_rate_per_service": "sum(rate(http_requests_total[1m])) by (service)",
        "p99_latency": 'http_request_duration_milliseconds{quantile="0.99"}',
        "p50_latency": 'http_request_duration_milliseconds{quantile="0.5"}',
        "db_connections_active": "db_connections_active",
        "db_pool_size": "db_pool_size",
    }
    results = {}
    try:
        async with httpx.AsyncClient() as client:
            for name, promql in health_queries.items():
                response = await client.get(
                    f"{PROMETHEUS_URL}/api/v1/query",
                    params={"query": promql},
                    timeout=10.0,
                )
                data = response.json()
                if data["status"] == "success" and data["data"]["result"]:
                    for r in data["data"]["result"]:
                        label = r["metric"].get(
                            "service", r["metric"].get("__name__", name)
                        )
                        results[f"{name}[{label}]"] = r["value"][1]
                else:
                    results[name] = "no data"

        summary = "Service Health Summary:\n"
        for k, v in sorted(results.items()):
            summary += f"  {k}: {v}\n"
        return {"content": [{"type": "text", "text": summary}], "isError": False}
    except Exception as e:
        return {
            "content": [{"type": "text", "text": f"Health check error: {e}"}],
            "isError": True,
        }
步骤 4:组装工具注册表
现在我们将所有工具定义合并到一个注册表中。MCP 服务器(sre_mcp_server.py)包含的工具超出了我们在笔记本中定义的范围:
get_logs— 应用级日志检索get_alerts— 警报历史(模拟)get_recent_deployments— 部署跟踪(模拟)execute_runbook— 结构化调查剧本write_postmortem— 事件文档
ALL_TOOLS = infrastructure_tools + prometheus_tools
MCP 服务器协议参考
MCP 服务器作为独立进程运行,通过标准输入/输出使用 JSON-RPC 进行通信。当 Claude Agent SDK 需要调用工具时,它会发送请求;服务器将请求路由到正确的处理程序并返回结果。
服务器处理四种 JSON-RPC 方法:
initialize— 与 SDK 握手(返回服务器能力)notifications/initialized— 确认通知(无需响应)tools/list— 返回所有可用工具的模式tools/call— 执行特定工具并返回结果
服务器循环从标准输入读取 JSON-RPC 请求,分派到相应的处理程序,并将结果写回标准输出:
async def main():
    reader = asyncio.StreamReader()
    protocol = asyncio.StreamReaderProtocol(reader)
    await loop.connect_read_pipe(lambda: protocol, sys.stdin)

    while True:
        line = await reader.readline()
        request = json.loads(line)

        if request["method"] == "initialize":
            send_result(request["id"], server_info)
        elif request["method"] == "tools/list":
            send_result(request["id"], {"tools": ALL_TOOLS})
        elif request["method"] == "tools/call":
            result = await dispatch(request["params"])
            send_result(request["id"], result)
每个工具调用流程如下:SDK 发送 JSON-RPC 请求 → 服务器分发给处理程序 → 处理程序返回结果 → SDK 接收响应。完整实现请参阅 sre_mcp_server.py。
第5步:安全钩子——写操作的安全护栏
MCP 工具处理器包含基本的安全检查(受限目录、允许的命令前缀)。钩子提供了第二层防御:shell 脚本验证代理正在更改内容的*内容*,而不仅仅是更改的*位置*。
钩子在工具执行前自动运行。如果 PreToolUse 钩子以非零状态退出,工具调用将被阻止。代理随后会看到错误,并必须调整其方法。
infra_setup.py 在 hooks/ 目录中生成两个钩子脚本:
validate_pool_size.sh— 解析edit_config_file调用中的new_value字段。如果新的DB_POOL_SIZE值超出安全范围(5–100),钩子以非零状态退出,编辑被阻止。validate_config_before_deploy.sh— 在重新部署 api-server 的run_shell_command调用之前触发。读取config/api-server.env,如果DB_POOL_SIZE超出安全范围,则阻止部署。
两个钩子都在下面的代理配置中注册为 PreToolUse 钩子——SDK 在相应工具执行前自动运行它们。
第6步:基线——代理在健康系统上的表现
在引入故障之前,我们先启动 Docker 栈,并让代理针对健康系统运行。这将建立一个基线——代理应报告所有服务运行正常。
我们启动所有服务(PostgreSQL、API 服务器、流量生成器、Prometheus),等待指标开始流动,然后让代理进行调查。
config_path = os.path.join(SRE_PROJECT_ROOT, "config", "api-server.env")
with open(config_path, "r") as f:
    content = f.read()
if "DB_POOL_SIZE=1" in content:
    with open(config_path, "w") as f:
        f.write(content.replace("DB_POOL_SIZE=1", "DB_POOL_SIZE=20"))

result = subprocess.run(
    ["docker-compose", "-f", "config/docker-compose.yml", "up", "-d"],
    cwd=SRE_PROJECT_ROOT,
    capture_output=True,
    text=True,
    check=True,
)

print("Waiting for Prometheus to begin scraping metrics...")
time.sleep(30)
print("Metrics are flowing.")
配置 Agent
现在,我们将所有部分整合在一起,在 Claude Agent SDK 上构建我们的 agent。
下面的 系统提示 刻意保持简洁。它给 Claude 一个通用的调查方法论(从健康检查开始,深入指标,检查日志,关联发现),但 *不* 规定调用哪些工具、以什么顺序调用,或如何解释结果。Claude 足够智能,仅凭工具描述就能自行推断。
这是构建高效 agent 的关键见解:投资于为 Claude 提供正确的工具和环境来执行任务。MCP 服务器的工具定义(你可以在 sre_mcp_server.py 中查看)告诉 Claude 每个工具做什么、期望什么输入,以及何时使用。有了这些上下文和 agent 循环,Claude 就能自主形成假设、选择正确的工具、解释结果并调整调查策略——就像一位经验丰富的 SRE 那样。
SYSTEM_PROMPT = """You are an expert SRE incident response bot. Your job is to investigate
production incidents quickly and thoroughly.

Investigation approach:
1. Start with get_service_health for a quick overview
2. Drill into error rates to identify affected services
3. Check latency — high latency often precedes errors
4. Investigate resources — DB connections, CPU, memory
5. Read container logs for specific error messages
6. Check config files for misconfigurations
7. Correlate and conclude — connect symptoms to root cause

Note: The api-server has baseline error noise (~0.1-0.2 errors/sec). Focus on significant spikes.

Be thorough but efficient. Always explain your reasoning."""
MCP_SERVER_PATH = Path(SRE_PROJECT_ROOT) / "sre_mcp_server.py"
assert MCP_SERVER_PATH.exists(), f"MCP server not found at {MCP_SERVER_PATH}"

HOOKS_DIR = os.path.join(SRE_PROJECT_ROOT, "hooks")

options = ClaudeAgentOptions(
    system_prompt=SYSTEM_PROMPT,
    mcp_servers={
        "sre": {
            "command": sys.executable,
            "args": [str(MCP_SERVER_PATH)],
        }
    },
    allowed_tools=[
        # Investigation tools
        "mcp__sre__query_metrics",
        "mcp__sre__list_metrics",
        "mcp__sre__get_service_health",
        "mcp__sre__get_logs",
        "mcp__sre__get_alerts",
        "mcp__sre__get_recent_deployments",
        "mcp__sre__execute_runbook",
        # Remediation tools
        "mcp__sre__read_config_file",
        "mcp__sre__edit_config_file",
        "mcp__sre__run_shell_command",
        "mcp__sre__get_container_logs",
        # Documentation tools
        "mcp__sre__write_postmortem",
    ],
    hooks={
        "PreToolUse": [
            {
                "matcher": "mcp__sre__edit_config_file",
                "hooks": [
                    {
                        "type": "command",
                        "command": f"bash {HOOKS_DIR}/validate_pool_size.sh",
                    }
                ],
            },
            {
                "matcher": "mcp__sre__run_shell_command",
                "hooks": [
                    {
                        "type": "command",
                        "command": f"bash {HOOKS_DIR}/validate_config_before_deploy.sh",
                    }
                ],
            },
        ],
    },
    permission_mode="acceptEdits",
    model=MODEL,
)
运行基线健康检查
智能体现在将调查健康系统。它应该查询指标、检查服务健康状况,并确认一切运行正常。
incident_report = """Check the health of all services and give me a quick status report.
Check error rates, latency, and DB connections."""
messages = []
async for message in query(prompt=incident_report, options=options):
    if isinstance(message, AssistantMessage):
        for block in message.content:
            if isinstance(block, TextBlock) and block.text.strip():
                print(f"\n{block.text.strip()}")
            elif isinstance(block, ToolUseBlock):
                tool_name = block.name.replace("mcp__sre__", "")
                print(f"\n[Tool] {tool_name}")
    elif isinstance(message, ResultMessage):
        if message.is_error:
            print(f"\nERROR: {message.result}")
    messages.append(message)
步骤 7:触发事件
现在我们引入一个破坏性变更,观察代理如何诊断并修复它。
该事件模拟了一个经典的 SRE 场景:数据库连接池耗尽。我们将 API 服务器的连接池从 20 个连接减少到 1 个。由于流量生成器持续发送请求,单个连接立即被淹没,导致:
- 500 错误率飙升至 20% 以上
- P99 延迟跃升至 1000ms 以上
- 数据库连接池显示耗尽
- 容器日志中充满连接超时错误
这正是那种会在半夜呼叫工程师的事件类型。
预期输出:配置变更被应用,api-server 被重新部署,30 秒后事件应在 Prometheus 指标中可见。
在运行下一个单元格之前,打开config/api-server.env并注意DB_POOL_SIZE=20。下面的单元格会将其改为1并重新部署——之后再次检查该文件以查看变更。
config_path = os.path.join(SRE_PROJECT_ROOT, "config", "api-server.env")
with open(config_path, "r") as f:
    content = f.read()

content = content.replace("DB_POOL_SIZE=20", "DB_POOL_SIZE=1")
with open(config_path, "w") as f:
    f.write(content)

subprocess.run(
    ["docker-compose", "-f", "config/docker-compose.yml", "up", "-d", "api-server"],
    cwd=SRE_PROJECT_ROOT,
    capture_output=True,
    text=True,
    check=True,
)

print("Fault injected: DB_POOL_SIZE=1. Waiting 30s for error metrics to accumulate...")
time.sleep(30)
print("Error successfully injected.")
在 Prometheus 中验证事件
在将此事交给代理之前,花点时间确认该事件在 Prometheus 中可见。在浏览器中打开 http://localhost:9090,并尝试以下 PromQL 查询:
rate(http_requests_total{status="500"}[1m])
如果你点击“Graph”标签页,应该会看到 /api/users 端点的错误率飙升。在基线测试期间,该错误率接近于零,而现在应该显著升高。
这些信号与代理将自主发现的信号相同。区别在于,代理还会将它们关联起来,追踪到 config/api-server.env 中的原因,修复错误配置,重新部署,并验证修复——所有这些都无需被告知要运行哪些查询或要查找什么。
步骤 7a:调查事件
首先,我们让代理仅进行调查——诊断问题而不采取任何补救措施。提示词故意模糊,类似于值班工程师从用户投诉中收到的信息。代理必须自行弄清楚其余内容。
观察代理如何处理此问题:
- 它从广泛的健康检查开始,然后缩小到故障服务
- 它根据发现的情况(而非脚本)选择要运行的 PromQL 查询
- 它关联多个信号(错误率 + 延迟 + 数据库连接 + 日志)以形成诊断
- 它读取配置文件以确认根本原因
预期输出:代理将 DB_POOL_SIZE=1 识别为事件的根本原因。
incident_report = """We're getting reports of API errors and timeouts from users.
Something is wrong with the api-server. Please investigate thoroughly:
- Check service health and error rates
- Look at DB connections and latency
- Check container logs for errors
- Look at the config files for any misconfigurations
- Identify the root cause

Report your findings but do NOT apply any fixes yet."""
investigation_messages = []
async for message in query(prompt=incident_report, options=options):
    if isinstance(message, AssistantMessage):
        for block in message.content:
            if isinstance(block, TextBlock) and block.text.strip():
                print(f"\n{block.text.strip()}")
            elif isinstance(block, ToolUseBlock):
                tool_name = block.name.replace("mcp__sre__", "")
                print(f"\n[Tool] {tool_name}")
    elif isinstance(message, ResultMessage):
        if message.is_error:
            print(f"\nERROR: {message.result}")
    investigation_messages.append(message)
调查的要点
回顾上面代理的输出。有几点值得注意:
- 代理自行选择了调查路径。 我们给了它一个模糊的提示("api-server 出了问题"),它自己决定调用哪些工具、查询哪些指标,以及如何关联信号。系统提示建议了通用方法,但代理根据每一步的发现进行了调整。
- 工具描述驱动了工具选择。 代理不需要被告知"运行
query_metrics,参数为rate(http_requests_total{status="500"}[1m])"——它阅读了工具的描述,理解了 PromQL 是查询错误率的方式,并自己构造了正确的查询。这就是为什么投资于清晰、详细的工具描述比编写复杂的提示更重要。
- 代理循环实现了多步推理。 单次 LLM 调用无法完成这一点。代理需要观察健康指标,发现问题,查询具体的错误率,检查数据库连接,读取日志,然后读取配置文件,每一步都为下一步提供信息。这种观察 → 推理 → 行动的循环是代理在运维任务中强大的原因。
- 这种模式具有通用性。 相同的架构(MCP 工具 + 代理循环 + 简单的系统提示)适用于其他运维领域,如竞争情报、基础设施分析、部署验证和合规审计。关键在于为你的领域定义合适的、范围明确的工具集。
现在让代理应用修复。
步骤 7b:应用修复
现在,我们让代理修复它诊断出的问题。这是一个单独的步骤,因为在生产环境中,您可能希望在授权修复之前由人工审查诊断结果。这是思考代理开发中人机协同的一个很好的例子:您希望代理何时自主执行,何时需要人工输入?
在运行下一个单元格之前,打开config/api-server.env并确认DB_POOL_SIZE=1—— 这是代理需要修复的故障状态。代理运行后,再次检查该文件,看它是否恢复为20。
代理应:
- 编辑
config/api-server.env以恢复DB_POOL_SIZE=20 - 使用修复后的配置重新部署 api-server
- 通过重新检查健康指标来验证修复
- 编写事后分析文档记录该事件
预期输出:代理修复配置,重新部署,确认指标健康,并编写事后分析。
fix_prompt = """Based on your investigation, the root cause is DB_POOL_SIZE=1 in config/api-server.env.
Please:
1. Fix the configuration by editing config/api-server.env to set DB_POOL_SIZE back to 20
2. Redeploy the api-server using run_shell_command with docker-compose
3. Wait a moment, then verify the fix by checking service health metrics
4. Write a post-mortem using the write_postmortem tool documenting what happened, the root cause, and the fix."""
remediation_messages = []
async for message in query(prompt=fix_prompt, options=options):
    if isinstance(message, AssistantMessage):
        for block in message.content:
            if isinstance(block, TextBlock) and block.text.strip():
                print(f"\n{block.text.strip()}")
            elif isinstance(block, ToolUseBlock):
                tool_name = block.name.replace("mcp__sre__", "")
                print(f"\n[Tool] {tool_name}")
    elif isinstance(message, ResultMessage):
        if message.is_error:
            print(f"\nERROR: {message.result}")
    remediation_messages.append(message)
事件总结
代理分两个阶段处理了整个事件生命周期:
- 调查:使用只读工具诊断根本原因
- 修复:使用写权限修复配置、重新部署并记录
这种分离反映了现实世界中的事件响应,其中诊断和行动是不同阶段,通常由不同人员执行或需要不同的授权级别。
检查结果:打开config/api-server.env确认DB_POOL_SIZE已恢复为20。然后查看postmortems/目录中代理生成的事件报告——它应包含摘要、根本原因分析、时间线和行动项。
步骤 8:清理
代理在修复过程中应已恢复 DB_POOL_SIZE=20。下面的单元格将验证修复结果,关闭 Docker 栈,并显示代理编写的任何事后分析。
config_path = os.path.join(SRE_PROJECT_ROOT, "config", "api-server.env")
with open(config_path, "r") as f:
    content = f.read()
if "DB_POOL_SIZE=1" in content:
    with open(config_path, "w") as f:
        f.write(content.replace("DB_POOL_SIZE=1", "DB_POOL_SIZE=20"))
    print("Config still had DB_POOL_SIZE=1 — restored to 20")
else:
    print("DB_POOL_SIZE=20 confirmed (agent fixed it successfully)")

subprocess.run(
    ["docker-compose", "-f", "config/docker-compose.yml", "down"],
    cwd=SRE_PROJECT_ROOT,
    capture_output=True,
    text=True,
    check=True,
)
print("Docker stack stopped.")

postmortems_dir = os.path.join(SRE_PROJECT_ROOT, "postmortems")
if os.path.exists(postmortems_dir):
    files = sorted(os.listdir(postmortems_dir))
    if files:
        print(f"\nPost-mortem: postmortems/{files[-1]}")
        with open(os.path.join(postmortems_dir, files[-1]), "r") as f:
            print(f.read())
扩展智能体:技能与运行手册
上面构建的智能体是通用型的。它可以查询 Prometheus、读取日志和编辑配置,但它没有编码特定于你的基础设施的任何机构知识。在实践中,SRE 团队维护运行手册、升级策略和事后剖析模板,这些模板捕获了来之不易的运维经验。你可以将这些知识编码为技能,让智能体自动遵循。
技能是 Markdown 文件,告诉智能体*何时*以及*如何*应用特定领域的程序。下面是一个示例技能文件,教智能体识别常见的事件模式:
---
name: runbook
description: Execute documented runbooks for common SRE incidents.
---

## When to Use This Skill

Trigger this skill when you identify one of these patterns:

### Database Connection Exhaustion
- `db_connections_active` > 90
- "too many connections" in logs

### High Latency Cascade
- P99 latency > 1000ms on api-server
- Latency spreading to downstream services

## Workflow
1. Identify the incident type from symptoms
2. Call `execute_runbook` with `phase="investigate"`
3. Follow the diagnostic steps
4. Call `execute_runbook` with `phase="remediate"`
5. Present remediation options before taking action
通过 ClaudeAgentOptions 将技能传递给代理:
options = ClaudeAgentOptions(
    system_prompt=SYSTEM_PROMPT,
    skills=[
        ".claude/skills/runbook/SKILL.md",
        ".claude/skills/postmortem/SKILL.md",
        ".claude/skills/code-review/SKILL.md",
    ],
    mcp_servers={"sre": {...}},
)
你可以为自己的环境构建的技能的一些想法:
- 事件运行手册 — 将你团队的现有运行手册编码,使代理遵循既定流程
- 事后分析模板 — 标准化事后分析结构,以匹配你组织的格式
- 升级策略 — 教代理哪个团队负责哪个服务,以及何时升级
- 变更审查 — 在应用配置更改之前,根据检查清单进行验证
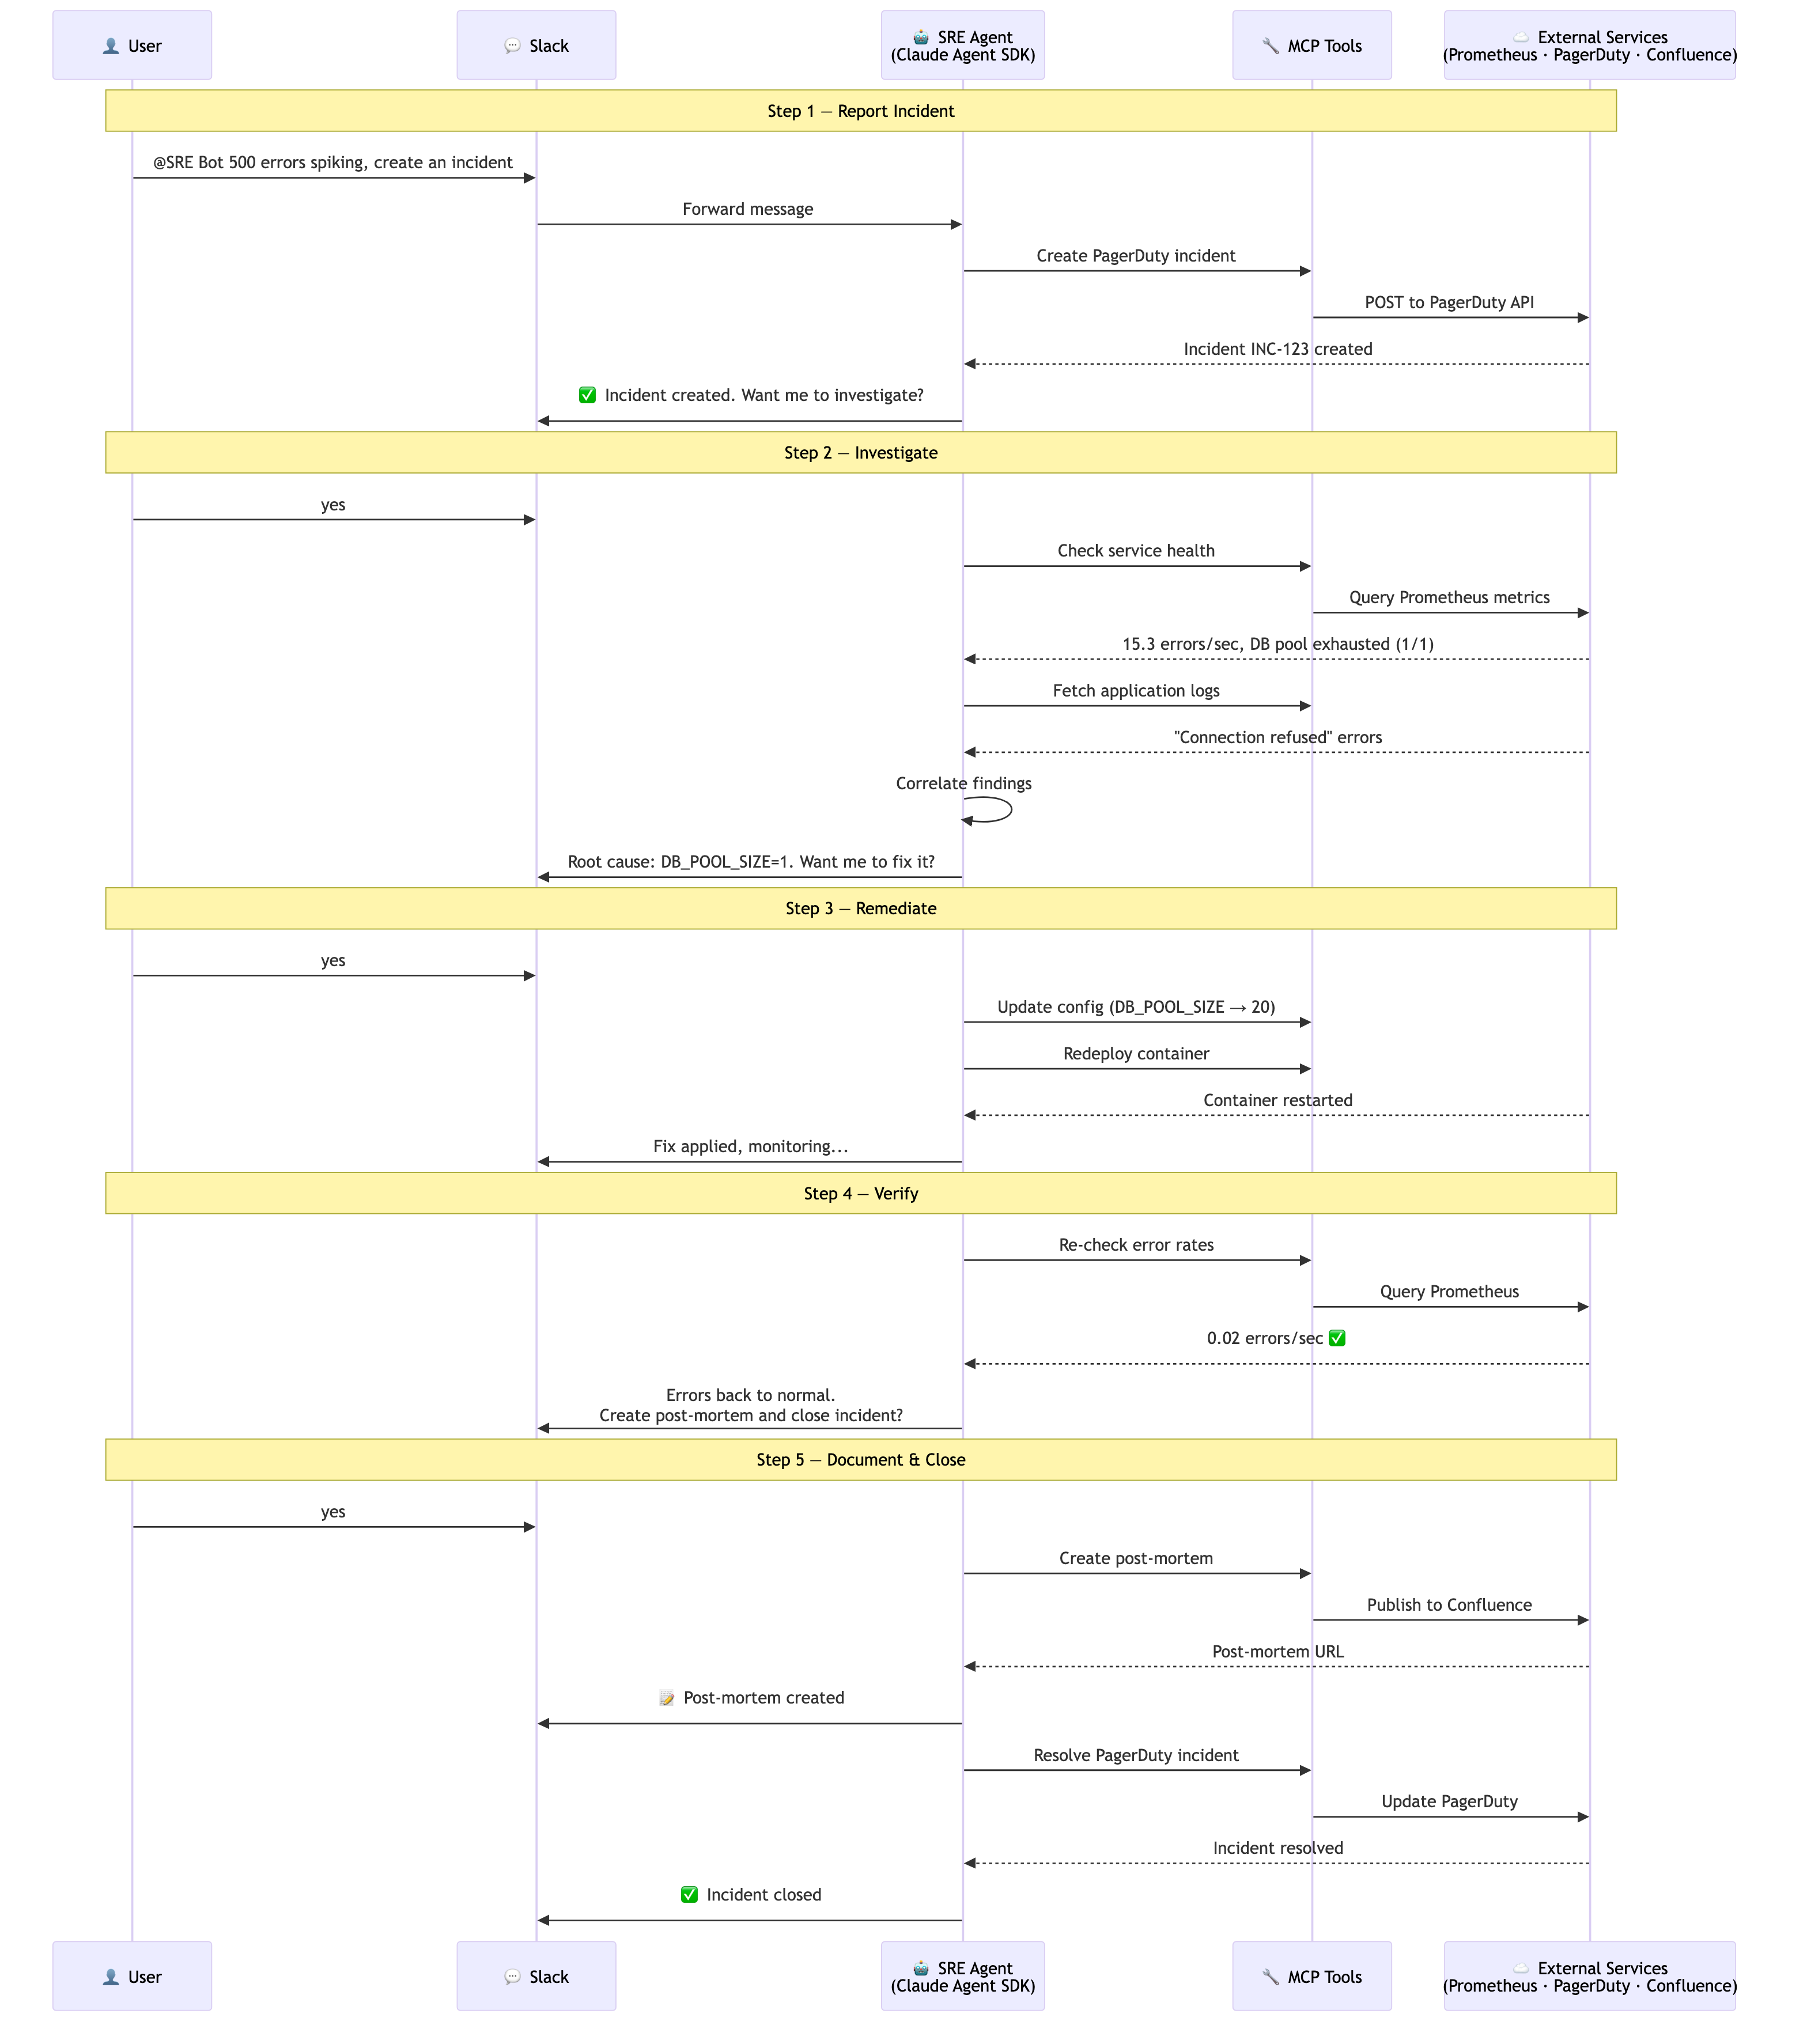
更进一步:生产环境集成
本笔记本中构建的智能体是调查和修复引擎。要将其部署到生产环境中,您可以将其与团队已使用的平台集成。MCP 服务器模式使这变得简单:将外部 API 包装在带有清晰描述的 MCP 工具中,将这些工具添加到 allowed_tools,智能体便会自动发现它们。
┌─────────────────┐
│  Slack          │  Messaging interface
│  @SRE Bot help! │  Engineers report incidents here
└────────┬────────┘
│
▼
┌──────────────┐      ┌─────────────────────┐      ┌─────────────────┐
│  PagerDuty   │◄────▶│   Claude Agent SDK  │◄────▶│  Confluence     │
│  Incidents   │      │   + MCP Server      │      │  Post-mortems   │
│  On-call     │      │                     │      │  Knowledge base │
└──────────────┘      └─────────────────────┘      └─────────────────┘
sre_mcp_server.py 已经包含了 PagerDuty 和 Confluence 的完整实现。这些工具是条件注册的,即只有在设置了相应的 API 密钥时才会出现。这意味着你只需添加环境变量即可启用它们,无需修改代码。
设置凭据
在项目根目录创建一个 .env 文件,并填入你想要启用的集成所需的凭据:
# PagerDuty (https://support.pagerduty.com/docs/api-access-keys)
PAGERDUTY_API_KEY=your-pagerduty-api-key
PAGERDUTY_SERVICE_ID=your-service-id          # The service to create incidents against
PAGERDUTY_FROM_EMAIL=oncall@yourcompany.com   # Email associated with your PagerDuty account

# Confluence (https://support.atlassian.com/atlassian-account/docs/manage-api-tokens-for-your-atlassian-account/)
CONFLUENCE_BASE_URL=https://yourcompany.atlassian.net/wiki
CONFLUENCE_API_TOKEN=your-confluence-api-token
CONFLUENCE_USER_EMAIL=you@yourcompany.com
CONFLUENCE_SPACE_KEY=SRE                      # Confluence space for post-mortems
CONFLUENCE_PARENT_PAGE_ID=12345               # Parent page ID for post-mortem pages
当 MCP 服务器启动时,它会检查这些环境变量。如果设置了 PAGERDUTY_API_KEY,则 4 个 PagerDuty 工具可用。如果设置了 CONFLUENCE_BASE_URL 和 CONFLUENCE_API_TOKEN,则 3 个 Confluence 工具可用。代理通过 tools/list 自动发现它们。
PagerDuty:事件管理
代理可以在创建重复事件之前检查现有事件,创建新事件以呼叫值班人员,在调查期间确认事件,并在修复后使用详细说明解决事件。
| 工具 | 用途 |
|------|------|
| pagerduty_list_incidents | 检查现有事件 |
| pagerduty_create_incident | 呼叫值班工程师 |
| pagerduty_update_incident | 确认或解决 |
| pagerduty_get_incident | 获取事件详情 |
Confluence:知识库
解决后,代理可以利用已有的调查上下文,在 Confluence 中生成结构化的复盘页面,包含摘要、时间线、根本原因、影响和行动项等部分。这取代了本笔记本中使用的本地 write_postmortem 工具。
| 工具 | 用途 |
|------|------|
| confluence_create_postmortem | 生成结构化的复盘页面 |
| confluence_list_postmortems | 搜索过去的事件 |
| confluence_get_page | 检索现有页面 |
Slack:消息接口
工程师通过在 Slack 频道中提及代理来与之交互。代理在线程中调查,实时流式传输工具调用和发现。同一线程中的后续消息继续对话。Slack 集成需要单独的部署文件(例如,使用 slack-bolt 的 sre_bot_slack.py)来监听 @提及并将消息中继到代理。有关示例实现,请参阅 examples/sre_bot_slack.py。
在代理中启用工具
将集成工具添加到代理配置中的 allowed_tools:
options = ClaudeAgentOptions(
    ...
    allowed_tools=[
        # ... existing investigation + remediation tools ...

        # PagerDuty (requires PAGERDUTY_API_KEY, PAGERDUTY_SERVICE_ID)
        "mcp__sre__pagerduty_create_incident",
        "mcp__sre__pagerduty_update_incident",
        "mcp__sre__pagerduty_get_incident",
        "mcp__sre__pagerduty_list_incidents",

        # Confluence (requires CONFLUENCE_BASE_URL, CONFLUENCE_API_TOKEN)
        "mcp__sre__confluence_create_postmortem",
        "mcp__sre__confluence_get_page",
        "mcp__sre__confluence_list_postmortems",
    ],
)
无需更改系统提示或MCP服务器。代理会从服务器发现新工具,并在适当时使用它们。
结论
本笔记本演示了当你给 Claude 一个代理循环和合适的工具时会发生什么。通过一个包含通用调查指导的简单系统提示,Claude 利用 12 个描述良好的 MCP 工具自主地:
- 查询 Prometheus 以检测升高的错误率和延迟
- 关联多个信号,将问题缩小到数据库连接耗尽
- 读取容器日志以确认假设
- 检查配置文件以找到根本原因
- 编辑配置,重新部署服务,并验证修复
- 在事后报告中记录整个事件
代理决定调用哪些工具、编写什么查询以及如何解释结果——根据每一步的发现调整其方法。这就是代理循环的力量:观察 → 推理 → 行动 → 重复。
下图说明了我们在本笔记本中构建的代理如何扩展到生产部署。核心代理循环(Claude Agent SDK)保持不变;变化的是你连接的工具、平台和技能集。在本笔记本中,我们使用了 Prometheus 和 Docker。在生产环境中,你可以为 Kubernetes、Slack、Confluence 以及你自己的可观测性堆栈添加 MCP 服务器,还可以添加自定义技能和钩子。每个 MCP 服务器都暴露了代理自动发现的作用域工具。想一想你的值班工程师在事件期间会使用哪些工具——这些就是你想要构建的工具。
 ### 从 Notebook 02 到 Notebook 03
在 Notebook 02 中,代理可以通过查询指标、检查 CI 状态、读取日志来观察。在本 notebook 中,代理可以*行动*。从只读观察到读写修复的飞跃,正是代理在生产环境中真正有用的关键。核心设计理念:通过窄范围的 MCP 工具提供写访问权限,并内置安全检查,而不是通过广泛的 shell 访问。
下一步
同样的模式(代理循环 + 限定工具 + 简单提示)适用于许多代理用例,例如:
运维与基础设施:
- 安全事件分类 — 关联警报、检查访问日志、隔离受影响系统
- 基础设施成本分析 — 查询云 API、识别浪费、提出并应用优化
- 部署验证 — 部署后检查健康指标,如果出现问题则回滚
业务流程自动化:
- 邮件分类与回复 — 阅读收到的邮件、分类紧急程度、起草回复、必要时升级
- 客户支持路由 — 分析工单、调取相关文档、建议解决方案、更新 CRM
- 发票处理 — 从文档中提取数据、与采购订单核对、标记差异
研究与分析:
- 竞争情报 — 监控来源、提取关键信号、编制结构化简报
- 合规审计 — 根据策略扫描配置、标记违规、生成报告
- 数据管道监控 — 检查数据新鲜度、验证行数、对异常发出警报
在每种情况下,配方都是一样的:为涉及的系统定义限定工具,为 Claude 提供代理循环,并编写描述目标的提示。
常见问题
常见错误包括:API密钥未设置、Docker服务未启动、Prometheus未抓取指标、工具调用被钩子阻止。排查方法:检查.env文件、docker-compose ps、Prometheus UI查询、钩子脚本日志。生产优化:增加超时、重试机制、日志聚合、更细粒度的权限控制。
企业应用扩展
可通过技能(Markdown文件)编码运行手册,集成PagerDuty、Confluence、Slack等平台。MCP服务器支持条件注册工具,只需设置环境变量即可启用。扩展方向包括安全事件分类、成本分析、部署验证等。
总结
本教程指导开发者构建一个基于Claude Agent SDK和MCP的SRE事件响应代理,能够自主调查、诊断并修复基础设施故障。通过模拟数据库连接池耗尽事件,展示代理如何综合Prometheus指标、容器日志和配置文件,识别根因并执行修复。教程强调安全设计,包括受限目录、命令白名单和验证钩子,并探讨人机协作、技能扩展及生产环境集成(PagerDuty、Confluence、Slack)。
- --
内容来源与验证
- 内容等级:PREMIUM_A
- 质量等级:S_CANDIDATE
- 难度:高级
- 验证等级:V1
- 原文作者:benlehrburger-ant, isabella-anthropic
- 原文日期:2026-02-16
- 来源许可:MIT
- 来源版本:
21f3c6080a0fb717ab66f98590c6a64295a1b871 - 查看原文
站内还有更多完整实战教程
加入会员,解锁全部教程、完整代码与持续更新内容。
加入会员